 |
| Figure 1: activity chart |
Bottom line presents summary for the time-period. It has a lot in common with traditional web analytics, where multiple counters are tracked per time-periods (whether it is visits per hour or number of "likes" per day). Looking at the chart, we can say that in the last period, we had 2 active accounts that produced 1 event of type "yellow star".
Now, what shall we do when our boss asks "why are we loosing accounts"? First, we must translate it to engineering language: "what behaviour patterns are intrinsic to <successful> and <failing> accounts, and how do they differ"?
Approach from chart above gives us good insight on feature usage (yesterday was St. Valentine's day, and users send 1M messages greeting each other), but apparently lacks ability to foresee if the user will stay, or is likely to leave.
What we need, is:
- Segregate accounts by lifespan criteria (or other criteria of success)
- Align accounts timeline (day 0 is the sign-up date)
- Aggregate users data to get pattern for accounts with given lifespan
 |
| Figure 2: behavior data patterns |
Figure 2 illustrates timeline aligning and data aggregation. To avoid cluttering, it lacks segregation by lifespan.
In summary, we engineered mechanism to extract behavioural data. For illustration purposes, let's assume that successful accounts add no less that 10 friends, and are followed by no less than 2 other accounts in first 5 days of its lifespan. Relatively to our terminology it can be 10 purple stars and 2 green.
Now, we can compare account's statistics against known behavioural patterns and predict account's lifespan. From business perspective, this information can be used to tailor boarding procedure to maximize user's lifespan (and thus - user's engagement into the social network).
For example: UI that reminds users to identify their friends, and propose former to follow the newcomer.
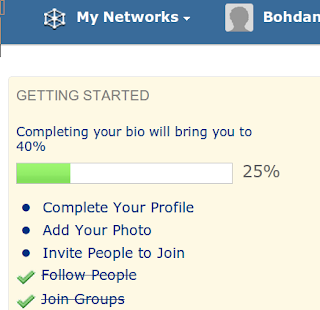
In real-world, there are multiple categories contributing to "success". What if we represent them as fraction of 100%, where 100% stands for matching appropriate behaviour pattern?
Wait... doesn't it seam familiar?
 |
| Figure 3: typical Social Network "profile completion" bar |
No comments:
Post a Comment